Back to Basics
Key project reference data points clearly explained. They help you to decide if a project is right for you.
No jargons - just the basics. We have 5 of them.
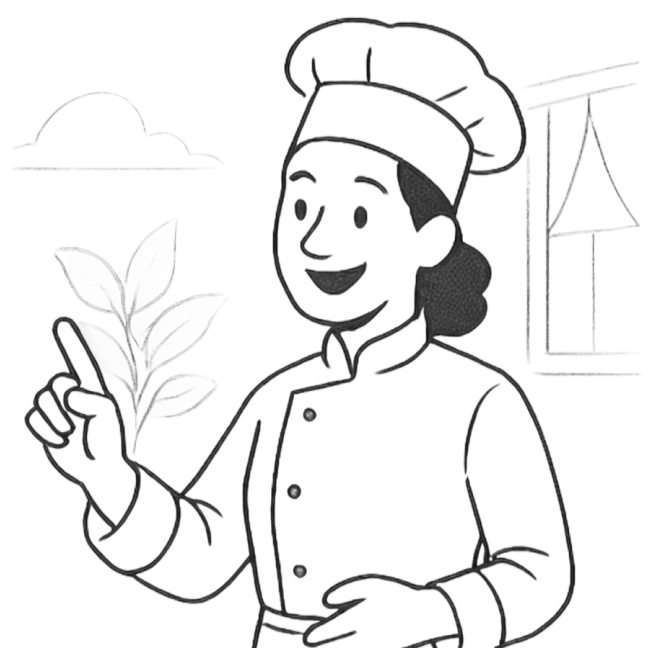
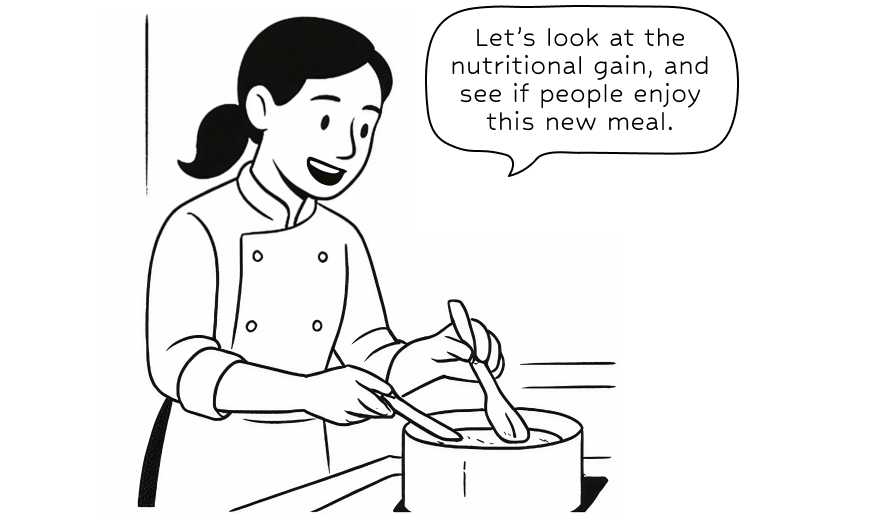
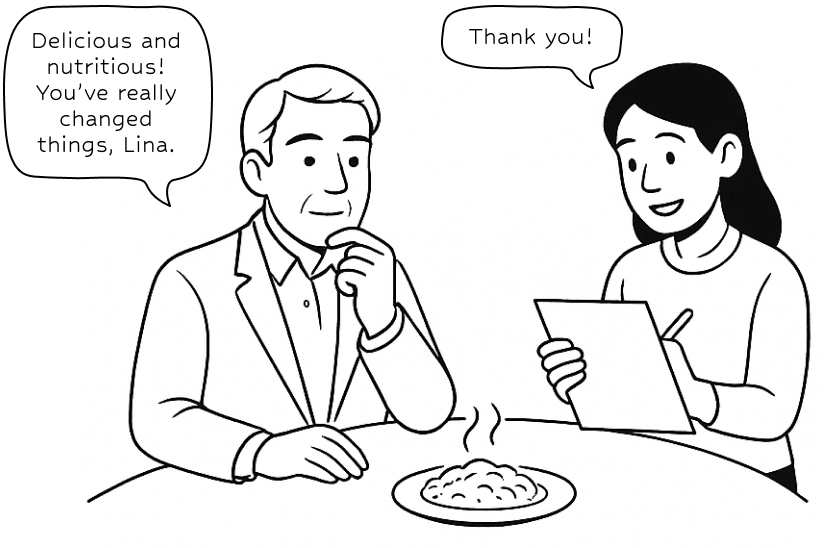
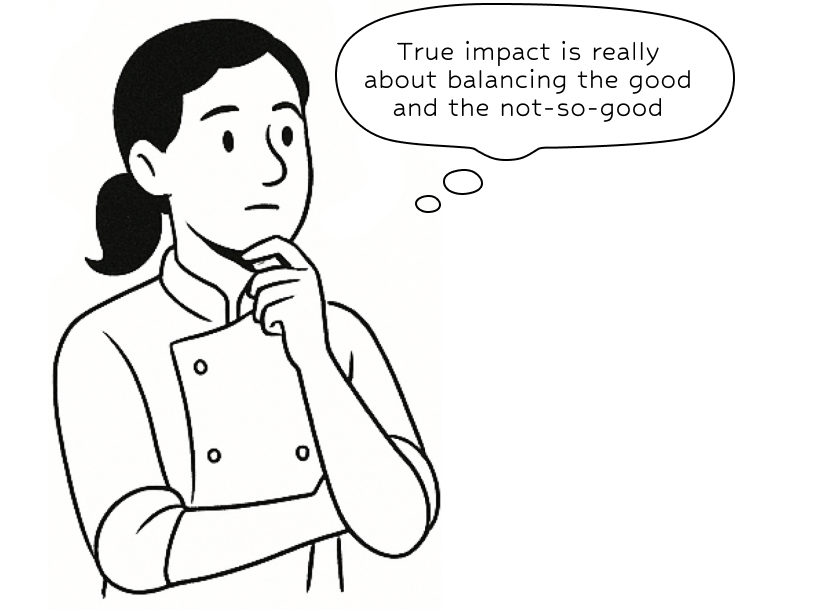
Meet Chef Lina,
A passionate cook known for her love of crafting healthy and special menus that truly make a difference in her community. She dreams of creating a signature dish that not only delights taste buds but also brings people together and promotes well-being.
Chef Lina works in a small town where most meals are bland and repetitive. The community's diet lacks variety and nutrition, and people have started to lose excitement about food. And in this small town is where we begin —
The Story of Chef Lina's Special Recipe
01.
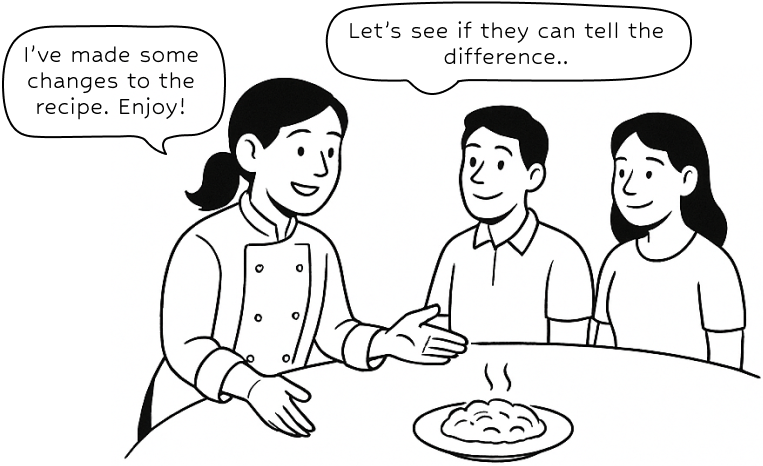
Additionality: The Missing Ingredient
Additionality tells us if your support is actually creating new climate action. We want to make sure the project is truly making a difference and isn't something that would have happened anyway.
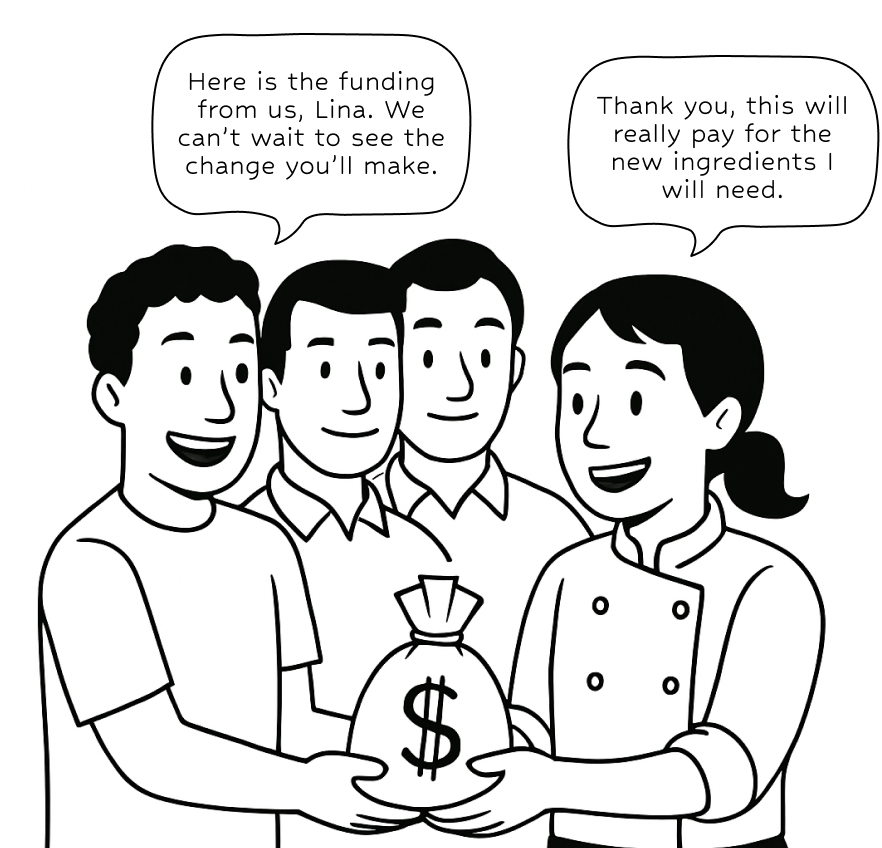
1-1
Funding Sources
If the project already has enough money from other sources, it might not need carbon credits to happen. We check where the money comes from and if there are financial barriers, so you know your support is needed.
1-2
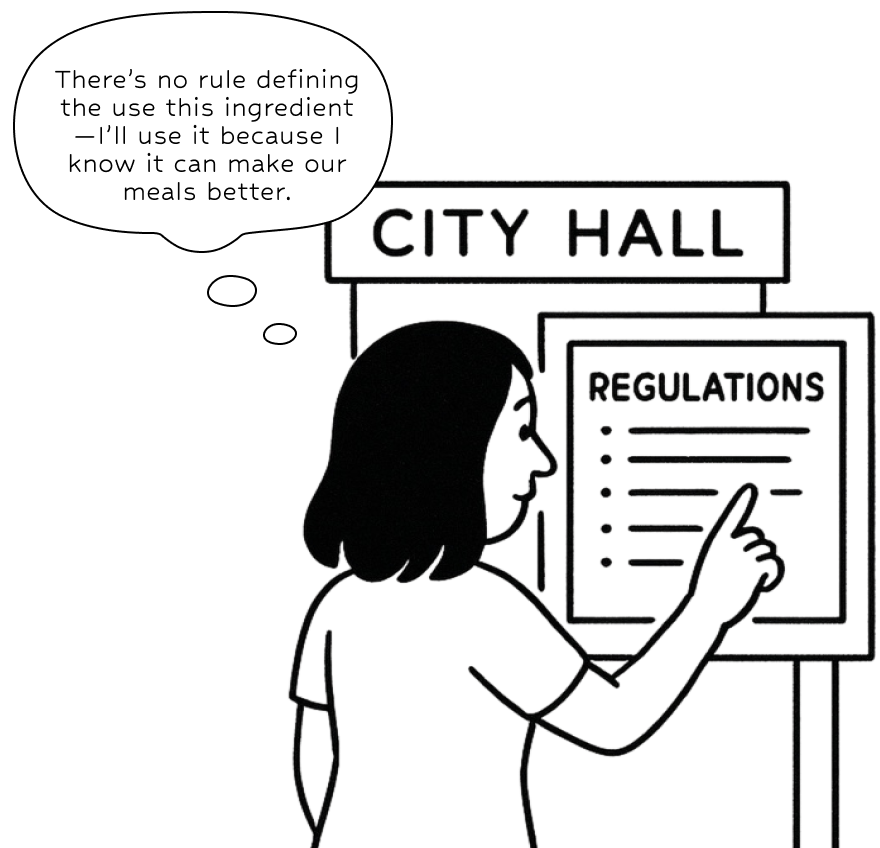
Legal/Regulatory Protection
If the law already requires these devices, then the project isn't extra. We check if there are any rules that would make the project happen anyway, so you're not paying for something that's already required.
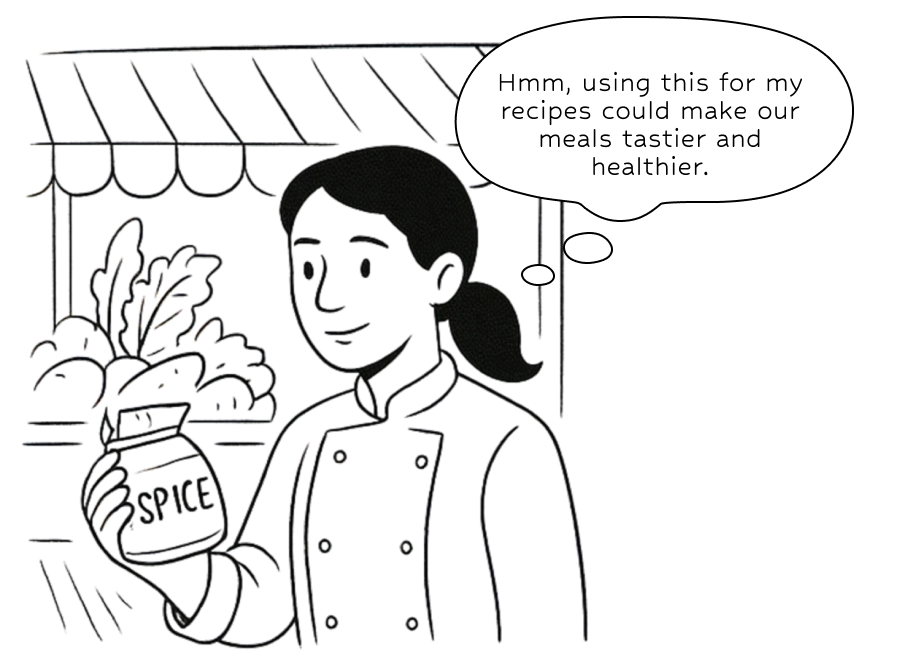
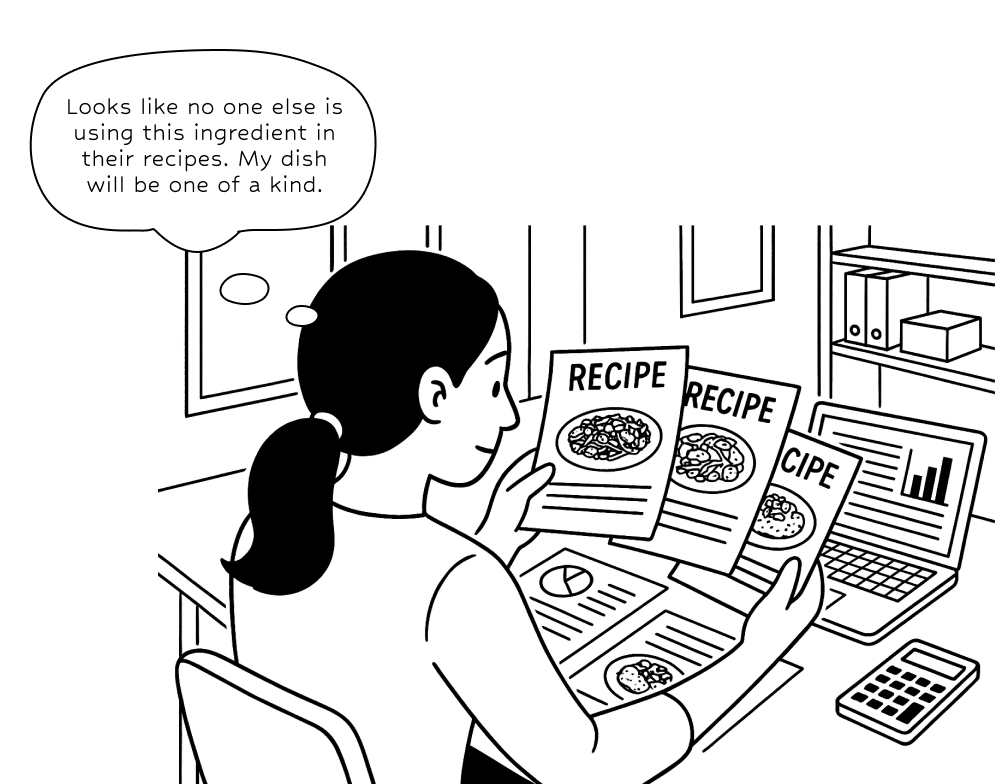
1-3
Similar Recipes
Such projects could be socially or culturally normal to occur even without carbon credits.
1-4
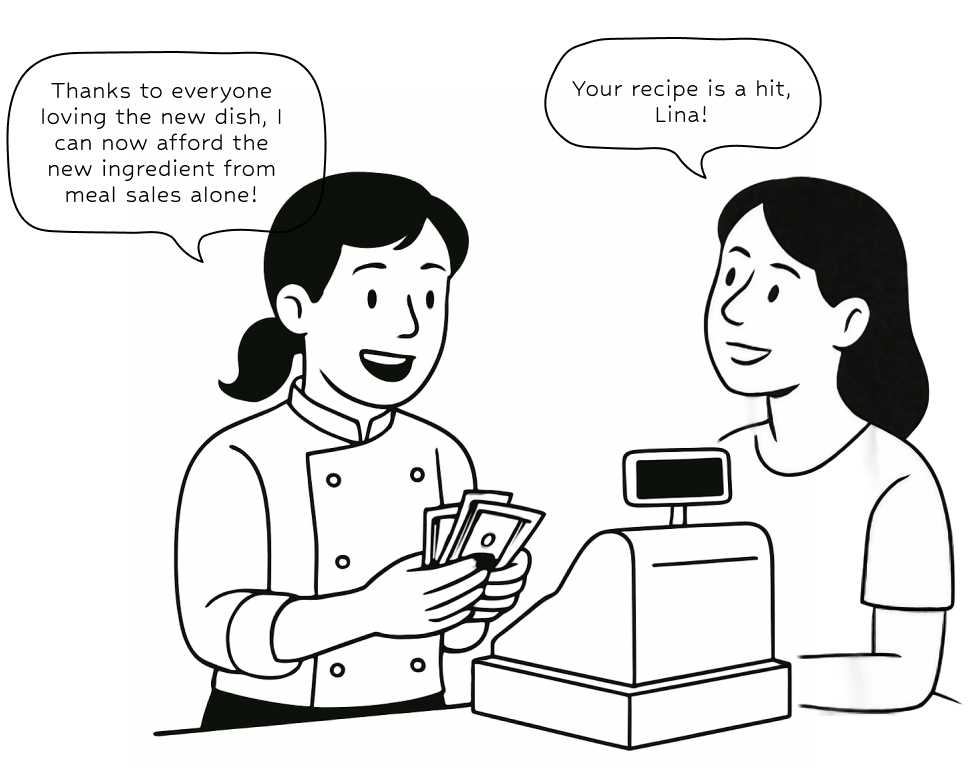
Use of New Revenue
You want to know how your money helps. We show how carbon credit sales are used-whether for running the project, helping the community, or other benefits.
02.
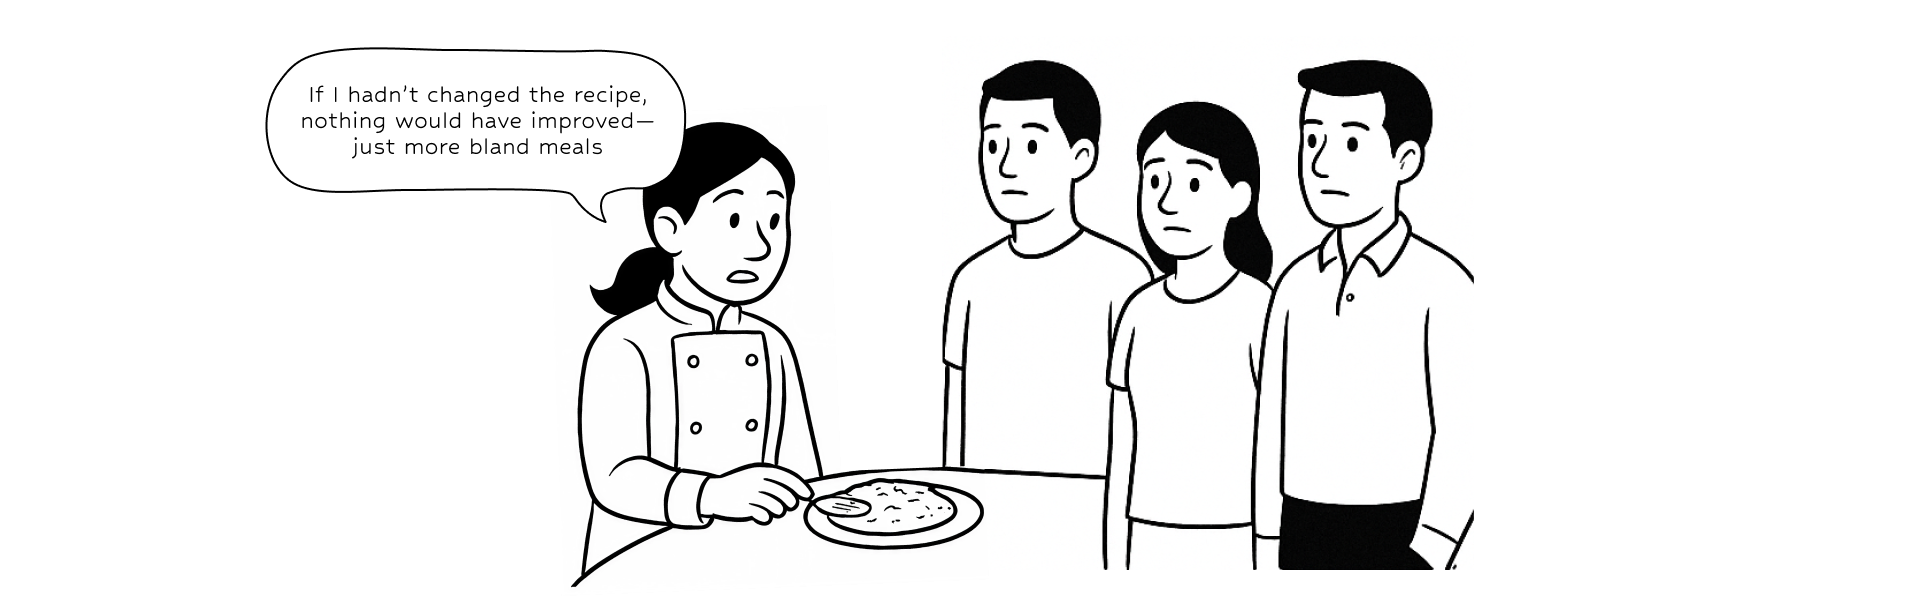
Baseline Scenario Before the Magic
The baseline is like the "before" picture. We need to know what would happen without the project, so we can measure the real impact.
2-1
Baseline Approach
It tells us how the "normal" situation is measured, so we can see what's changed.
2-2
Parameters Used to Calculate the Baseline
These are the key numbers and facts used to figure out the baseline. We explain what they mean, where they come from, and why they matter.
2-3
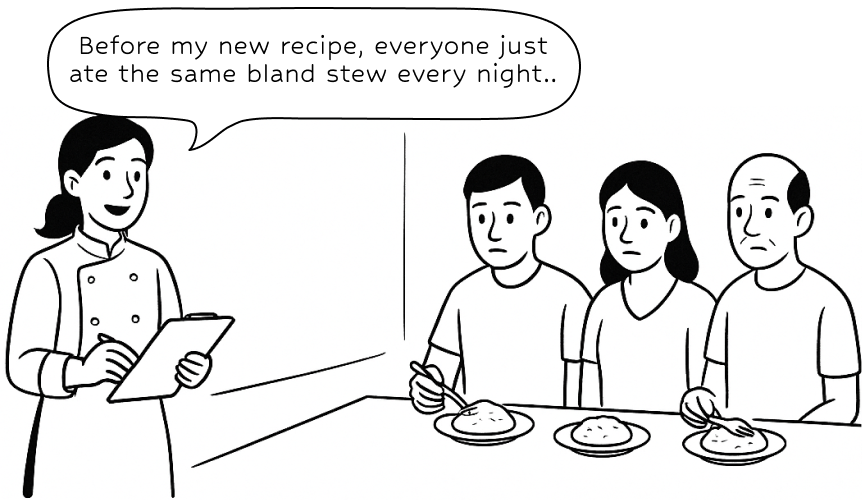
Business-as-usual Scenario Without special
ingredient for the new recipe
This shows what would likely happen if the project didn't exist-like continued pollution or
deforestation-so you can see the true difference the project makes.
03.
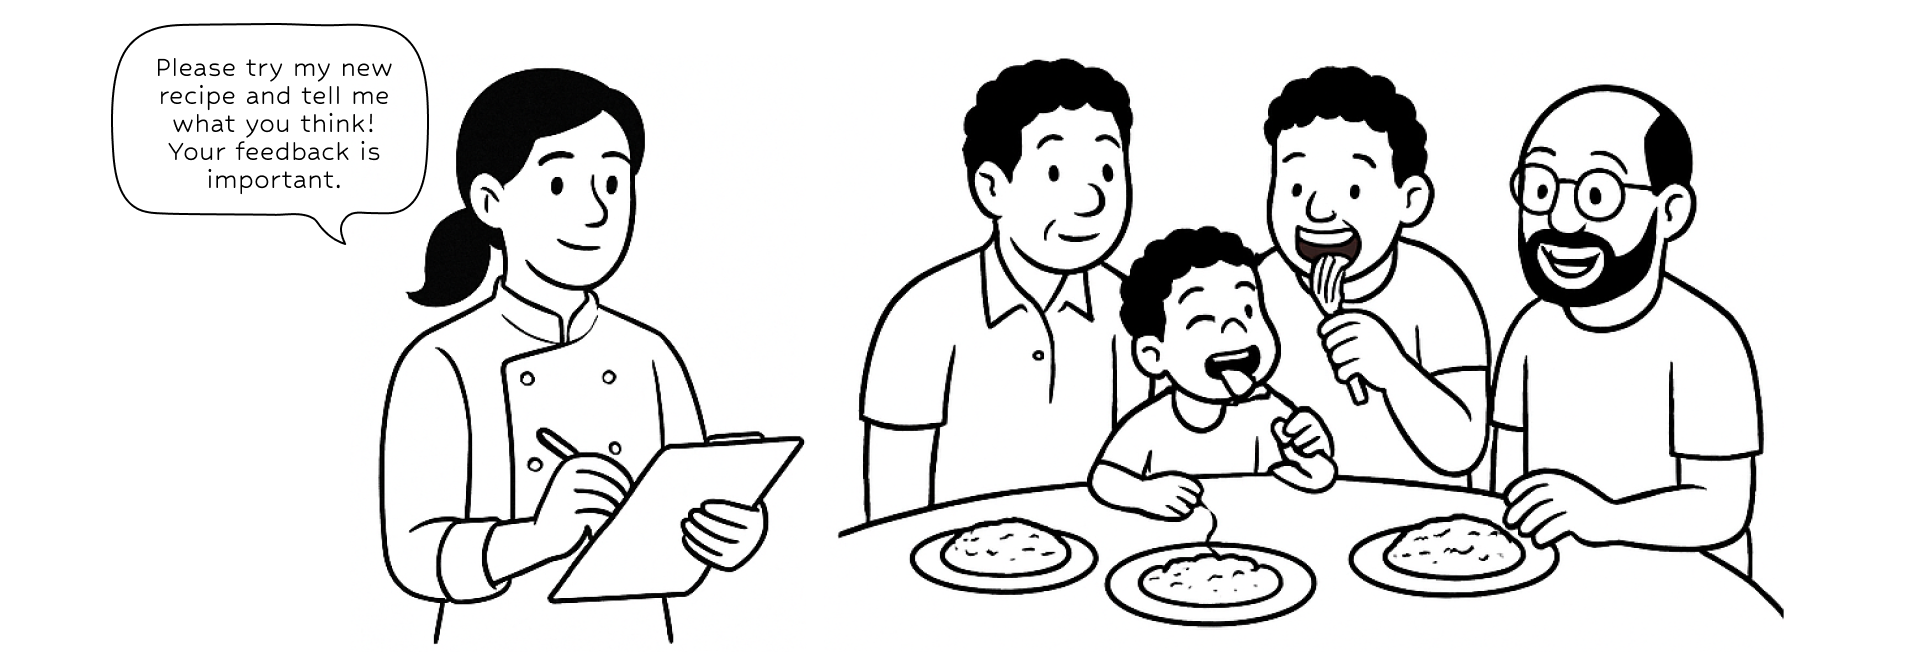
Verification & Quantification: The Taste Test
We want to be sure the project's impact is real and measured correctly.
3-1
Measurement Approach
Explains how the project measures carbon savings such as the sampling data for forestry or households,
how accurate the results are, and what technology is used.
3-2
Verification
An independent expert checks the results. This gives you confidence the numbers are real, not just claims.
3-3
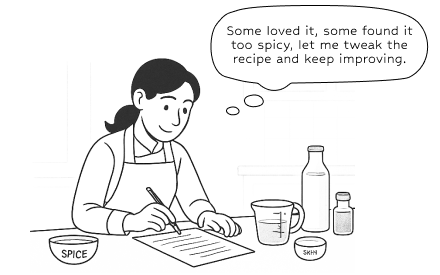
Successes vs Failures
No project is perfect. We show both the wins and the challenges, so you get the full picture.
04.
Leakage: Watching for Side Effects
Sometimes, fixing one problem can accidentally cause another. Leakage checks for these side effects.
4-1
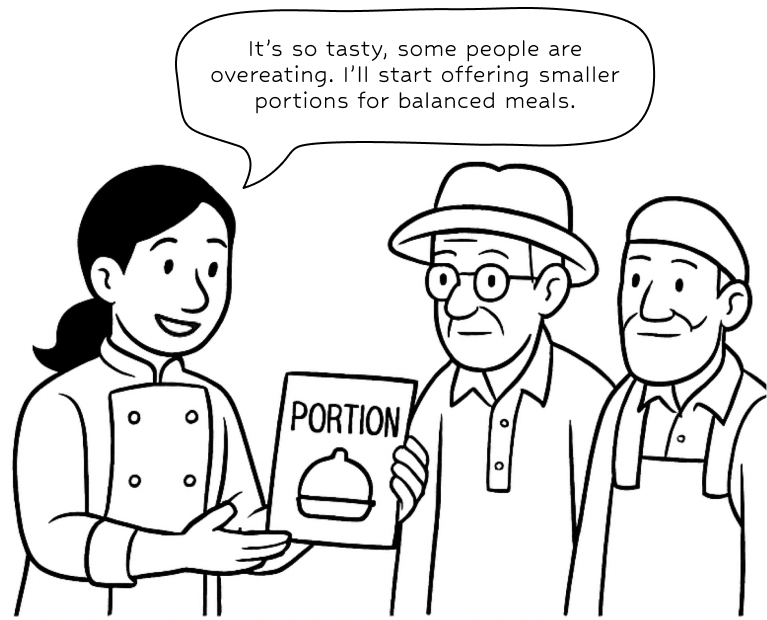
Behaviour Induced Leakage
If people blatantly produce more emissions because they use the "energy saving device" more for example, it will negate the emissions saved. We check if this happens and how it's fixed.
4-1
Market Leakage
If the project causes problems elsewhere (like shifting pollution), we look for that and see what's done about it.
4-2
Total Leakage Factored in Calculation
We show the total adjustment made to the carbon credits to account for any side effects.
05.
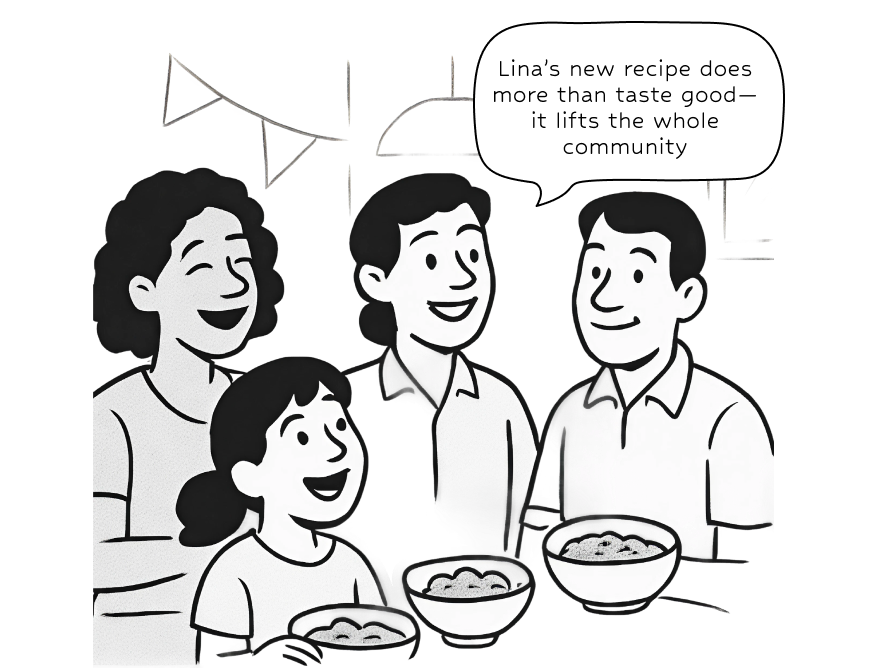
Co-benefits: More Than Just a Meal
Carbon projects can do more than just reduce emissions-they can help communities and nature too.
5-1
Co-benefits
Shows extra good things the project does, like improving health or protecting wildlife.
5-2
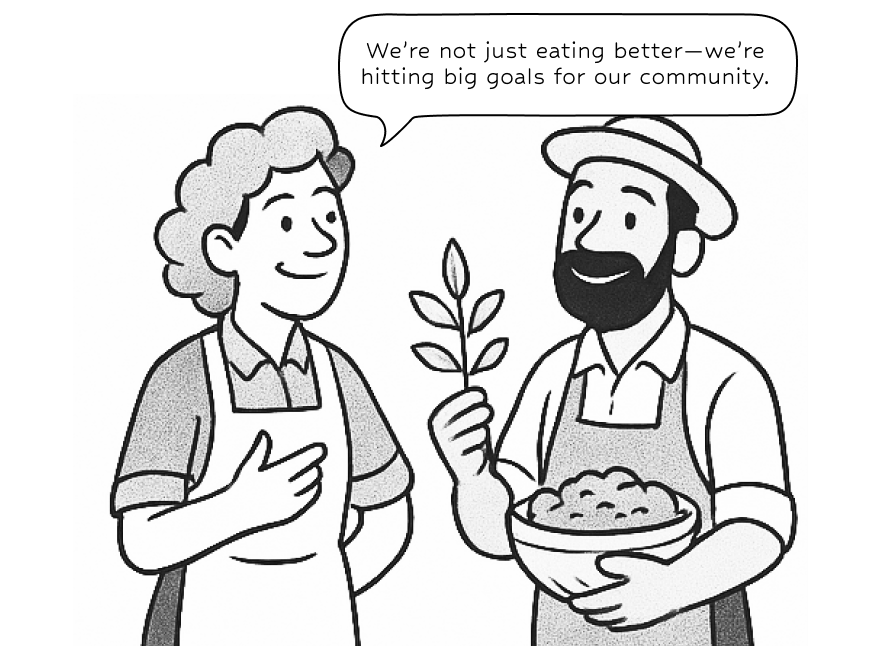
Sustainable Development Goals
Tells you which global goals the project helps you achieve.
5-3
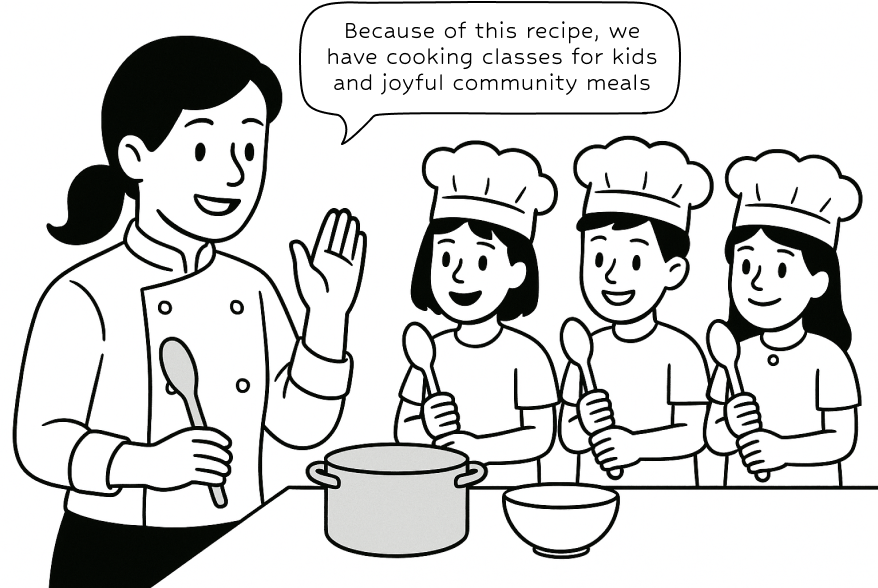
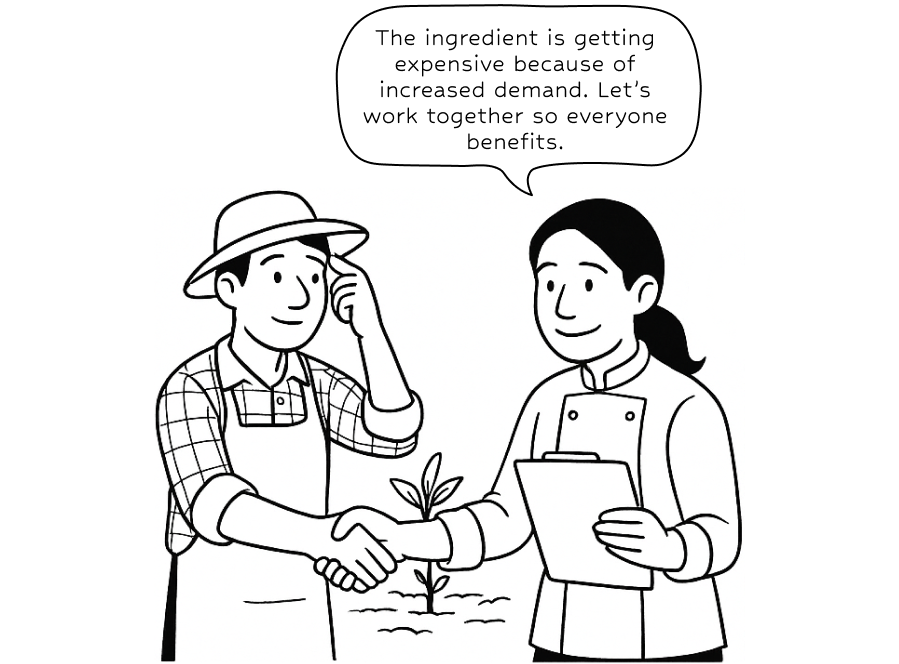
Community Benefits from New Recipe with Special Ingredient
The benefits go beyond the plate—everyone shares in the joy. Shows exactly how the money from carbon credits helps local people.